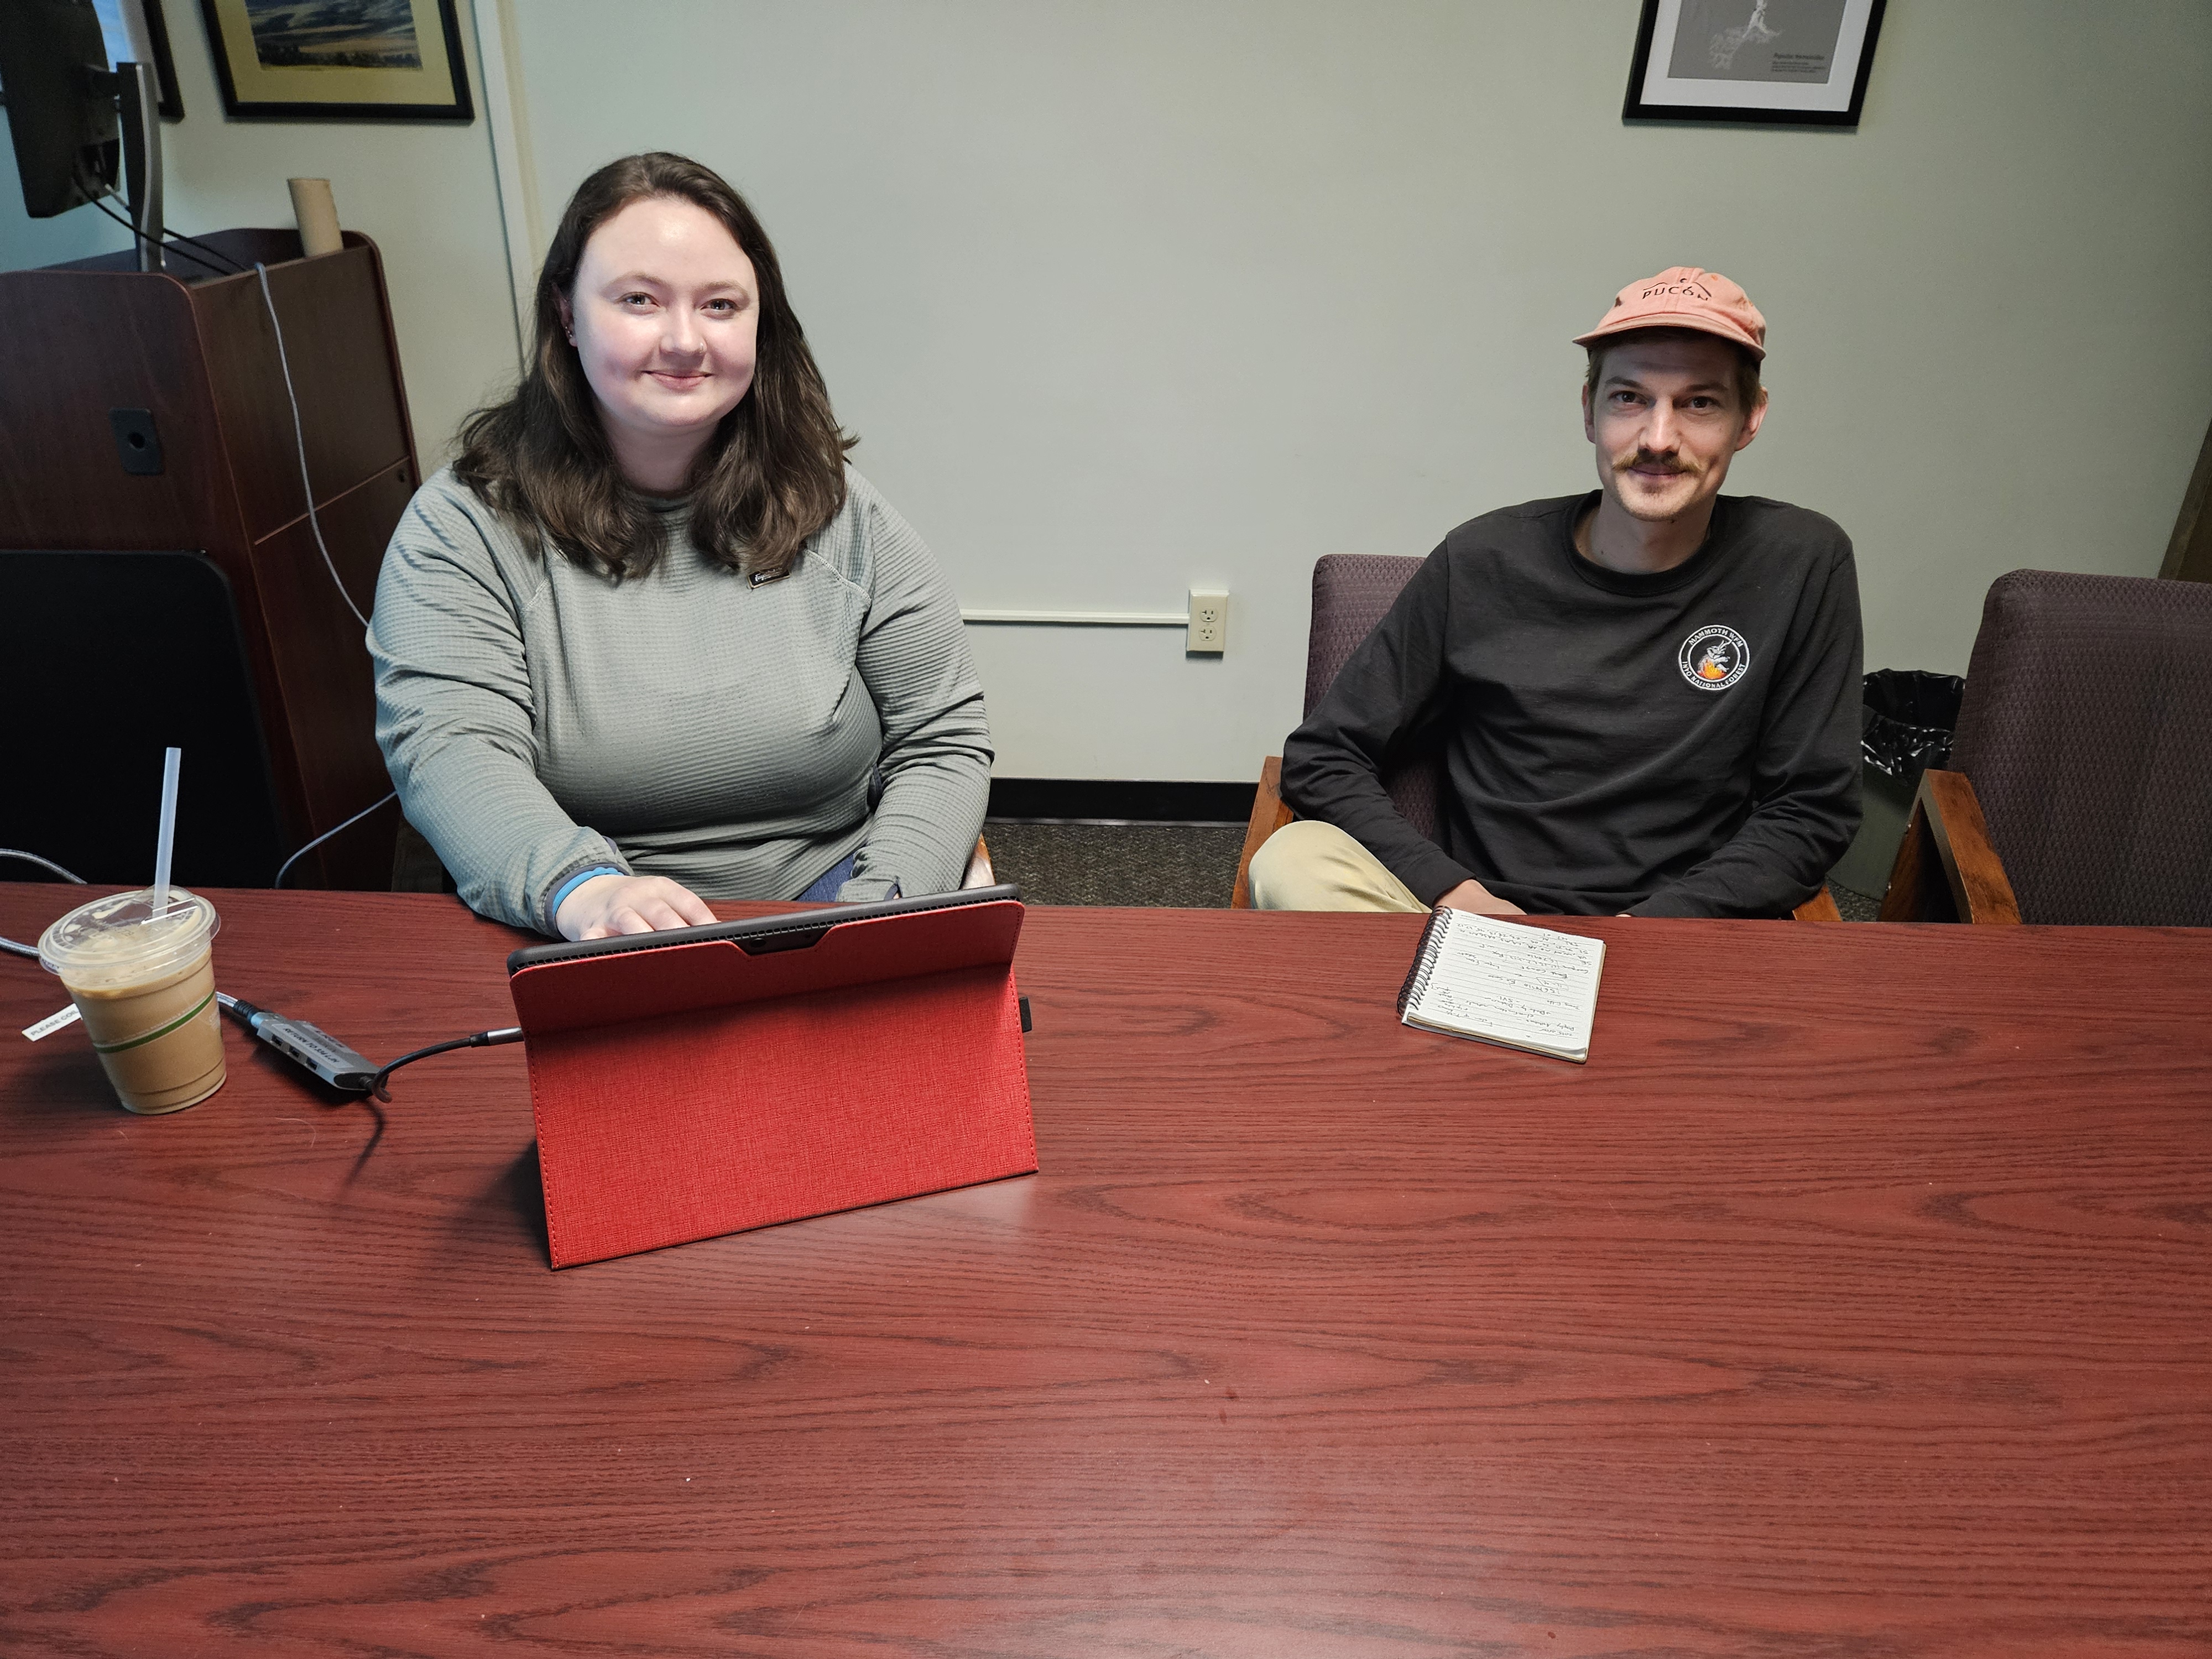
Kristen Intemann, Professor of Philosophy and Director for the Center for Science, Technology, Ethics, and Society (C-STES) at Montana State University (MSU), is working with graduate students in Land Resources and Environmental Sciences (LRES) at MSU to construct maps to analyze which communities and Tribal Nations are particularly impacted by both wildfire smoke and smoke from prescribed burns in Montana and across the U.S. This project is a product of the Social Psychology, Economics, and Ethics (SPEE) thrust of the SMART FIRES project. Richard Schoenberg and Reilly Tunby are both Masters students in LRES with expertise that intersects geospatial mapping, wildfire science, and environmental health. Richard (Rich) Schoenberg is a Graduate Research Assistant for the SMART FIRES project, and Reilly is working on the project as part of a course.
What are the goals of this project?
One of the foundational questions of the SMART FIRES project is: How do the smoke emissions from prescribed fire affect individuals and communities? To help answer this question, the team uses GIS mapping to identify areas that have experienced the greatest number of days of unhealthy air quality from wildfire smoke and prescribed burn smoke per year between 2006-2020. Using the Center for Disease Control (CDC) social vulnerability index (SVI) data, they can identify communities and Tribal Nations most impacted by smoke. This effort involves considering factors such as age, ethnicity, average household income, access to healthcare, transportation, and other variables that predict higher health risks from smoke exposure. This will allow the team to identify communities where there is elevated risk from smoke exposure. Distinguishing between prescribed burn smoke and wildfire smoke will allow the team to make recommendations in identifying communities that could benefit from prescribed burns and other wildfire prevention strategies. It will also help allocate resources to protect against smoke exposure and guide the implementation of prescribed burning practices that advance environmental justice and reduce health disparities. These maps will be used in future years of the SMART FIRES project to develop communication and outreach tools around prescribed burns and smoke protection that are responsive to the needs of different communities and Tribal Nations.
What is currently being mapped?
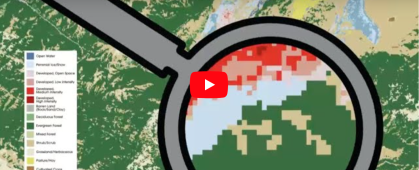
The team is using ArcGIS to construct two maps at different scales. First, they are mapping the state of Montana at the 10 km scale. This map shows the number of smoke days per year above the Environmental Protection Agency (EPA) fine particle limit of 35 micrograms per cubic meter average over 24 hours year from 2006-2020. This is the level at which exposure to fine particle pollution can lead to a variety of health problems, including cardiac arrest, strokes, and premature death. This is then overlaid with social vulnerability index (SVI) data calculated from a variety of census data variables (age, ethnicity, number of people in household, average household income, transportation, and access to medical care) that predict health vulnerability to smoke and fine particle pollution. This map also shows population density and federally recognized tribal lands.
Second, the team is mapping the continental U.S. to show both the number of smoke days above the EPA limit and the SVI data at the census tract level. For both maps, smoke caused by wildfires and smoke caused by prescribed burns are distinguished from one another. This differentiation is done by separating the smoke data according to seasonality. It is assumed that smoke pollution during fire season is caused by wildfires and winter (and shoulder season) smoke is caused by prescribed burns. One of the team’s initial findings is that almost all of the days of smoke exposure over the EPA limit happen during summer months (which vary slightly in different states and regions).
How did you get started on this project? What inspired you to pursue this research?
Rich initially became interested in this project during his graduate studies while investigating the effectiveness of managed fire operations in mitigating the negative effects of high-severity wildfires in dry conifer forests. His research showed a statistically significant decrease in wildfire severities that impacted managed fire operations; however, it did not explore smoke effects in this context. When Rich saw this project, he was excited to have the opportunity to leverage some of his geospatial and fire science experience in public health research.
Reilly was originally looking into a similar topic for the final research project of her master’s program. When she learned about this research from her advisor, she shifted focus slightly to see if she could join the project. Initially, she was interested in researching fires and smoke because of the environmental and health impacts they have. Reilly was excited to join this project because it was already in line with her research ideas, and she was able to contribute to something that will eventually be utilized in informing public health decisions.
What challenges or limitations have you encountered during the mapping process, particularly in relation to data collection, analysis, or interpretation, and how have you addressed or mitigated these challenges?
Along with the typical challenges of locating and formatting publicly available data, distinguishing smoke from prescribed fires and wildfires proved to be a complex task, especially considering regional and inter-annual differences in "fire seasons" versus "prescribed fire seasons." The team based their delineation on referencing publicly available data through the Monitoring Trends in Burn Severity program (MTBS) to determine when most prescribed fire events occurred in each region.
Reilly has been primarily working with the demographic and social data aspect of the map, which was created from Census data and used to calculate various social measurements. One of the biggest challenges she has come across is sorting through the dozens of variables included, and finding a way to display them in a way that not only shows the information needed but shows it in a way that can be easily understood by the public as the project progresses. This component is a work in progress as she explores options to map this data along with the smoke data.
How do you determine the difference between prescribed burns and wildfire smoke when mapping air quality data? Is seasonality alone enough or is there potential for overlapping between wildfires and prescribed fires?
Currently, delineations of prescribed fire smoke and wildfire smoke are based on region-specific seasonality. While this approach does not consider other drivers of prescribed fire seasons, such as resource constraints or local weather patterns, it is believed it can serve as a starting point to indicate the magnitude and direction of smoke impacts. For this initial investigation, prescribed fire seasons are described by the months when most operations occur in a region. This works well in northern latitudes where snowfall and climate often definitively mark the beginning and end of fire seasons, but not as effectively in regions like the Southeastern United States, where prescribed fires are documented to occur year-round.
Most of the days with elevated smoke levels occur in the summer instead of the winter, which for states with distinct seasons like Montana is a good indicator that they are occurring because of wildfires. It will be harder to determine the source of smoke in regions with less seasonal variation, but more insight will come as the project progresses.
Beyond the immediate research objectives, how do you envision the utilization of the constructed maps and associated findings in facilitating communication, outreach, and decision-making processes concerning prescribed burns, smoke protection measures, and environmental justice initiatives within affected communities and Tribal Nations?
The maps that have been created, alongside insights from social science experts and team members, can highlight the impact of smoke on specific communities. The project is still in the initial stages, but clear visuals of how prescribed burns and wildfires affect air quality will help improve communication and outreach efforts in affected communities and Tribal Nations.
Being able to overlay smoke data and community vulnerability data on one map will eventually allow researchers, decision-makers, and even the public to better understand where outreach and resources are needed. As the team learns more about where the smoke comes from and if prescribed burning has an impact on the number of severe smoke days, as well as where the smoke overlaps communities, they are hopeful that this work can help build understanding as to where outreach is needed. Ultimately, the team hopes that this mapping project will help researchers and decision-makers explore ways to reduce the impact of smoke on the public.